
Welcome to my e-portfolio; this page has been subdivided into three sections that contain samples of original works I have created and refined throughout the duration of EDDL 5131. I hope you find something useful, and I welcome your comments at the end of the post.
Here are is the Gallery Directory:
Creating an Educational Infographic
Creating an Interactive Graphic
Creating and Editing Video
I enjoyed composing and shooting the storyline in this little project, and I combined stills, time-lapse video, editing in sounds, transitions, and even a little cinematic trick (well, sort of a poor cousin of the ‘pushthrough’) in making this. Probably did more than I needed, but hey, I was having fun.
I think one thing that would make a huge difference is a quality microphone and stand, and a bounce card and stand. This would ‘fix’ some of the small audio inconsistencies, and the bounce card would even out the light on subjects in frame.
I think for my students, I would be happy to have them stick with the pre-packaged video and audio treatments, as it would allow more focus on content, and less on production. That said, I think it is important to model ‘what could be’, to a certain degree, so as to inspire as well as inform.
Downloadable file link for Beers Around
Downloadable Transcript of Beers Around in .doc format
Downloadable Transcript of Beers Around in .pdf format
Download Screencast Transcription with Citations
Click here for the Creating and Editing Video Screencast Download link
References
Beer Overflowing Image, Creative Commons, https://image.freepik.com/free-photo/glass-beer-alcohol-drink-with-overflowing-foam_8087-3090.jpg
MacLeod, K., “Meanwhile In Bavaria”. Creative Commons, https://incompetech.com/music/royalty-free/index.html?isrc=USUAN1500057#google_vignette
Perlick Bar and Beverage, “The Four Elements of an Effective Beer System”. Used with attribution, https://blog.perlick.com/wp-content/uploads/2018/06/The-Advantages-of-Glycol-Cooled-Beer-Lines.jpg
Creating an Educational Infographic

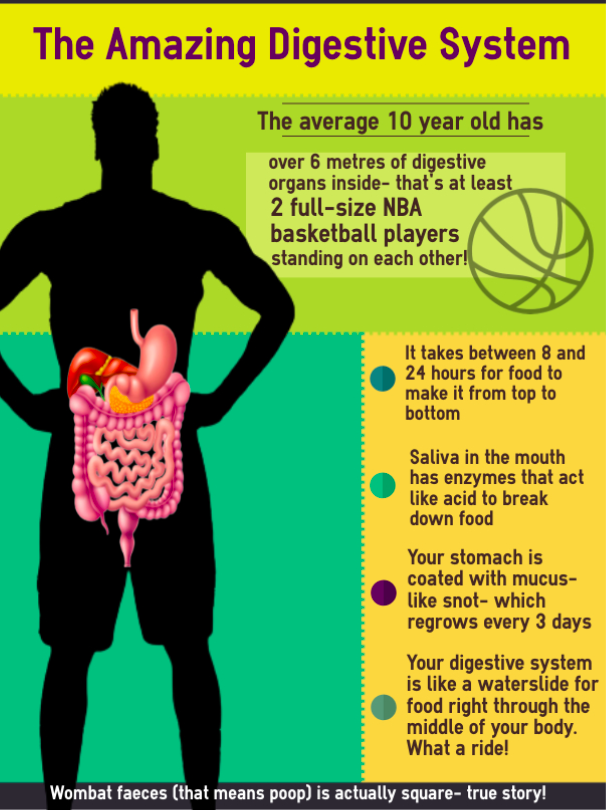
Click the picture for a larger version of the image.
This infographic was created in easel.ly, and used a template that was…inflexible to work with. I used much of the feedback from my peers to re-evaluate the graphic, moving some pieces that interfered with the reading, re-phrasing certain text to make more sense, and positioning and enlarging font size for readability. I upgraded my graphic by making my own silhouette, which adds to the interest factor of the overall poster by fully embracing the basketball theme. When initially generating my first infographic, I used the Dunlap and Lowenthal (2016) schema that I applied to create user engagement, consisting of the situational qualities of immediacy, malleability, compellingness, resonance, and coherence. In tailoring the hook to the target audience, a sense of immediacy is created as most of the learners receiving this are in that 9 to 12-year age range. By “asking learners questions that encourage reflection” (Dunlap & Lowenthal, p. 47) or by giving statements that are immediately relatable, the viewers start interacting on first glance. This malleability relates viewers to the information, as in “I have that”, “I had that”, or “I will have that”.
Click here for a transcription of the Infographic Screen Recording
Click here for a link to the original post
Click here for the download link for Creating an Educational Infographic Screencast
Creating an Educational Infographic
The original graphic and its derivative photos and videos are sourced through Creative Commons licensing (WikiCommons). The changes made to this particular graphic were based on feedback received from my peers through my blog. I tried to use a diverse array of supplementary resources in order to appeal to the dynamic structure, and to create user engagement through employing situational qualities as cited in Dunlap and Lowenthal (2016). Transcripts were provided for all videos for accessibility for differently abled or hearing challenged users; in some video, the audio could be an issue that it may distract or interfere with other media (Mayer, 2014).
Click here for a transcription of the Interactive Graphic Screen Recording
Click here for a link to the original post on Creating an Interactive Graphic
Click here for the download link for Creating an Interactive Graphic Screencast
Paul Chong
Hi Ryan,
Thanks for sharing all the media in your portfolio. I liked the videos and the screencast of you showing how you put your video together. I wish we could enjoy some beer together to celebrate the end of the course!
Paul
Ryan MacGregor
It’s been great ‘working’ with you as well, Paul! Thanks for your contributions, and I wish you success moving forward with your education!